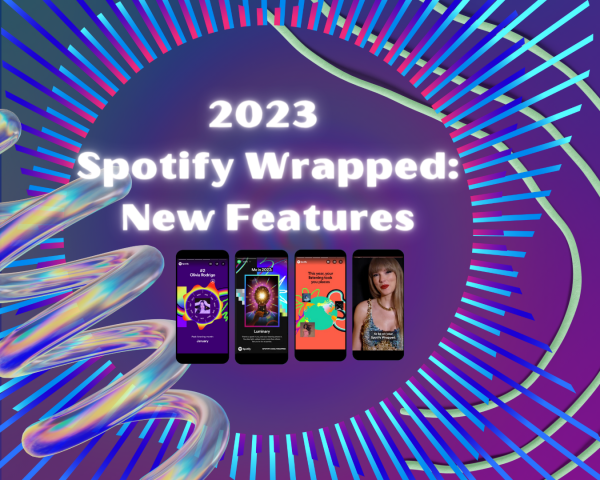
It is that magical time of year once again: a time of showing off your superior taste and judging the habits of your closest friends. It is Spotify Wrapped season.
In 2016, Spotify began releasing a yearly statistics recap for its premium subscribers — known as Spotify Wrapped. Wrapped summarizes your music habits from January to October with colorful designs and easily shareable graphics. At its core, it’s a marketing tool to promote Spotify subscriptions. But for its users, it has become so much more.
It is now an annual “holiday”, with many hoping that they did not listen to anything embarrassing, wondering if their friends spent more or less time listening and, once it finally comes out, sharing it on their stories and scrolling through everyone else’s listening tendencies.
In this article, I will be going through each of the sections included this year to see how they measure up to years past. All examples used come from my own Wrapped, so I encourage you to not judge yourself too harshly when comparing your statistics to mine.
The Classics
In every Wrapped, a few statistics show up frequently: genres, total listening time, top five artists and top five songs. While the graphics change each year, these metrics remain the same. The compilation of data is the main attraction that captivates users before it then appears in a shareable graphic.
The top five genres received a very odd theme this year; they were displayed as a sandwich to depict your music “tastes.” These categories remain rather bare bones in terms of the information they provide you, and in the future, I hope they include more details about each person’s genre preferences. For example, your Wrapped tells you how long you listened to your top artist and top song, but I wish they would tell you the minutes for the rest of your top five in both categories. I want to know how much I listened to all of my favorite artists and songs and compare them.
Peak Listening
This year, a notable addition to Wrapped is the addition of the “peak listening” category, which combines both total listening time and your top five artists. Concerning total listening time, users are informed about the specific day they listened to Spotify the most and how long that was. For me, my peak listening time was 306 minutes on Oct. 2. While it doesn’t mean much, it was fun thinking back to that day and reflecting on what made me listen to five hours of music.
For the top five artists, Spotify provided a horoscope-esque graphic depicting the month you listened to each of your top five the most. For me, each peak lined up with the release of new music. The total time I spent listening to Olivia Rodrigo’s music peaked in September, coinciding with the release of her sophomore album “GUTS” on Sept. 15, 2023. But for a friend of mine, his peaks correlated more with the events in his life throughout the year. The data adds a new reflective dimension, encouraging users to reflect on their year through the songs they listened to. I hope they include this feature again in 2024.
Sound Town
Your “sound town” page gives you a city with similar listening patterns. Wrapped located me in Davis, Calif. It seems intriguing at first, but the purpose of this information is unclear. It was mostly just a filler for the next statistic.
This feature has sparked humorous discourse online. Many articles and posts have come out questioning why so many LGBTQ+ individuals are receiving results tied to cities like Berkeley, Burlington and Cambridge. But other than that, this section does not do much to explain your music tastes.
Listening Character
The introduction of the “listening character” on this page adds an unusual twist to the typical Wrapped. On this page, you get assigned a “listening character” based on how you listen to music. These can range from shapeshifter to luminary to vampire and beyond.
I was labeled an alchemist because I created a lot of playlists and solely listened to them. This was my least favorite section in Wrapped. I don’t think it represents me, especially since I mainly make one playlist per season with my favorite songs that I listen to on repeat. I would have preferred a title based on the vibes or genres of my music, rather than my creation of playlists.
This feature seems reminiscent of the audio aura from Wrapped 2021 which told you your top music moods and made a graphic combining the associated colors. That is a much more fun and interesting statistic, and I would like to see it be reintroduced in the future.
Artist Messages
Lastly, artist messages have returned. Many artists — including Taylor Swift, Post Malone and Olivia Rodrigo — recorded short video messages to be shared with their top fans. The videos look like they are recorded on the artists’ phone’s selfie camera, which provides a personal touch. It is a fun inclusion, allowing the artists to express gratitude and communicate briefly with their fans. After watching several of these videos from different artists, they all seem to follow a similar script. Despite the intention to feel personal, the messages can be highly saccharine and feel less personal than they are meant to be.
This was another fun year for Spotify Wrapped. Despite a few awkward decisions, it ultimately succeeded in what it set out to do: give users easily shareable and visually appealing statistics for discussions with friends.
I hope you had a great time reminiscing on your year with your Wrapped and that it was everything you hoped it would be. Even if it wasn’t as good as mine — I mean, I have the Spice Girls in my top songs; how can you beat that?